- HOME
- Solar System Design
Solar System Design
How Residential Solar Systems Are Engineered for Long-Term Performance

Design Is Not Panel Placement
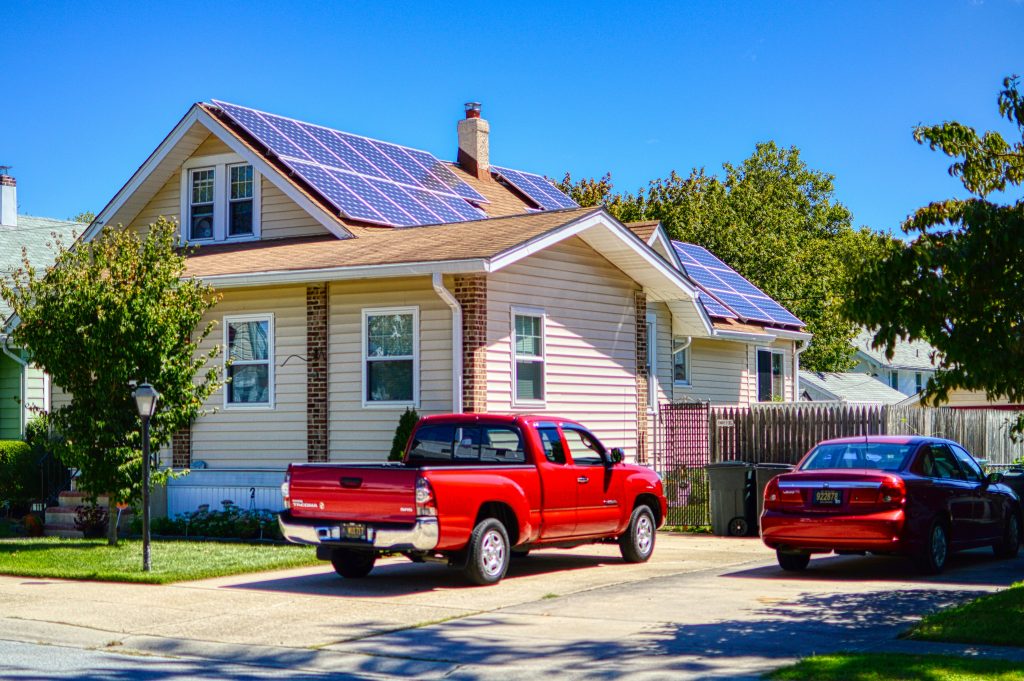
When most homeowners receive a solar proposal, the design element they focus on is the roof layout diagram: a satellite image with rectangles representing panels. That visual is the least important part of system design.
System design is the process of determining how much electricity a given property can and should produce, how that production aligns with the home’s actual consumption pattern, how the system integrates with the utility’s interconnection requirements, and whether it is sized to serve the home’s energy needs not just today but across a 25-year ownership horizon.
Equipment selection (which panels, which inverter) is secondary to design execution. A well-designed system using mainstream equipment will outperform a poorly designed system using premium equipment over any meaningful time horizon. The variables that determine whether a solar system delivers on its projected economics are almost entirely design variables, not equipment variables.
A complete residential system design addresses:
Annual production targeting relative to actual household consumption. Roof geometry optimization across available surfaces. Shading identification and mitigation strategy. Inverter architecture selection relative to site conditions. Electrical infrastructure constraints and upgrade requirements. Interconnection compliance with the applicable utility territory. Long-term rate exposure modeling. Future electrification planning and load growth accommodation.
Each of these is examined below.
Is My Solar System Designed Correctly?
This is the question most homeowners do not know to ask, and the one most worth asking before signing a contract.
A correctly designed system starts with a thorough analysis of the home’s electricity consumption, not with a panel count. It accounts for shading conditions using methodology that reflects actual sun angles across all seasons, not just favorable ones. It produces a kilowatt-hour estimate based on conservative, documented assumptions rather than optimistic inputs that maximize the appearance of financial return. And it accounts for how the home’s energy needs may change over the life of the system.
The sections below provide the framework for evaluating whether a given proposal reflects that standard.
Usage Modeling: The Foundation of System Design
Historical Consumption Analysis
A solar system is sized to serve a home’s electricity consumption. That consumption must be understood accurately before a system size can be determined responsibly.
The appropriate starting point is a 12-month kilowatt-hour history from the utility account: not a single recent bill, not an estimate based on square footage, and not an industry average applied to the home’s location. Twelve months of actual metered consumption data captures the full seasonal variation in the home’s load profile, which in Maryland is substantial.
A home that uses 800 kWh in March and 1,800 kWh in July has a consumption pattern that a single-month review fundamentally misrepresents. The summer peak (driven by air conditioning) is the most energy-intensive period for most Maryland households. The winter trough reflects reduced cooling load but may include elevated heating load if the home uses electric resistance heat or a heat pump. The gap between the highest and lowest monthly usage for a typical Maryland home often exceeds a factor of two.
Designing a system against a single month’s usage, or against a back-of-envelope average, produces a system sized for a consumption profile that does not exist. The result is either an undersized system that falls meaningfully short of its projected offset, or an oversized system that generates more excess production than net metering credits can practically recover.
Seasonal consumption variation also affects how production and consumption interact across the year. Maryland solar systems produce the most electricity in May, June, and July: months with long days and high sun angles. They produce the least in November, December, and January. A home’s electricity usage pattern may or may not align with that production curve. A home with high summer cooling load and a well-oriented south-facing roof may find that summer production and summer consumption track closely. A home that heats electrically in winter and uses little air conditioning may find that winter production falls well short of winter consumption while summer production generates significant excess. Net metering smooths this mismatch across the annual settlement period, but the mismatch itself affects how system size should be determined.
Peak Versus Base Load
Not all kilowatt-hours in a monthly total are equivalent from a design perspective. A home’s base load (the electricity consumed continuously by always-on equipment like refrigerators, water heaters in standby, electronics, and HVAC controls) behaves differently from peak load driven by high-draw appliances cycling on and off throughout the day.
Understanding whether a home’s consumption is driven primarily by base load or by discrete high-draw events affects both system sizing and, in territories with time-of-use rate structures, the potential value of battery storage in shifting consumption to off-peak periods.
The Offset Percentage
The offset percentage (the proportion of annual electricity consumption that a solar system is projected to generate) is one of the most commonly cited and least rigorously defined metrics in residential solar proposals.
An offset percentage is calculated by dividing projected annual system production by annual household consumption. A system projected to produce 12,000 kWh annually for a home that consumes 12,000 kWh is described as a 100% offset system. That framing is straightforward. The complications lie in what the number actually represents and how reliably it holds over time.
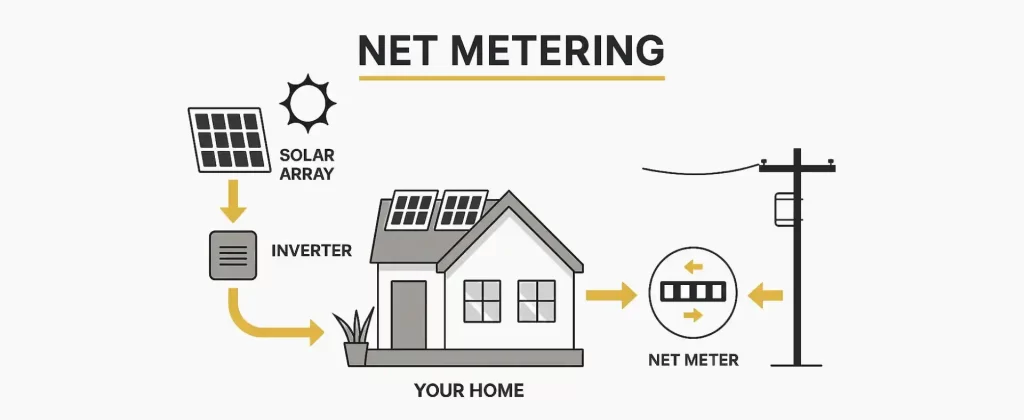
First, a 100% annual offset under net metering does not mean the home is electricity-independent. It means that over the course of a full year, the system produces as much electricity as the home consumes. The production and consumption do not occur simultaneously. The home draws grid electricity at night and exports excess solar during the day. Net metering’s monthly rollover and annual settlement mechanism makes this work financially, but the 100% offset number describes a net annual accounting outcome, not a continuous self-sufficiency condition.
Second, the offset percentage is a projection, not a guarantee. It is the output of a production model that rests on assumptions about sun hours, panel degradation, shading losses, inverter efficiency, and temperature effects. If any of those assumptions are optimistic, the actual offset percentage in year one and beyond will be lower than projected. The integrity of those assumptions is covered in the production modeling section below.
Third, 100% offset is not always the correct design target. A home that anticipates adding an electric vehicle, converting from gas heat to a heat pump, or expanding its square footage within the next several years may be better served by a system sized to a higher offset percentage relative to current consumption, building headroom for load growth rather than precisely matching today’s usage. A system that achieves 85% offset today but accommodates a heat pump addition without requiring a costly expansion is a better long-term design than one that achieves 100% offset today and requires a panel addition (with its associated permitting, interconnection, and labor costs) in three years.
Conversely, oversizing a system beyond what net metering can practically compensate is also a design error. In Maryland’s net metering framework, excess annual production that rolls over without being consumed generates a credit that settles at a rate typically lower than the retail rate. Designing a system that consistently generates more electricity than the home can consume or credit is a misallocation of capital.
The offset percentage discussion, done correctly, is not a simple target. It is the output of a consumption analysis, a production model, and a load growth conversation.
Future Load Projections
System design that accounts only for current consumption is incomplete design.
A solar system installed today will operate for 25 to 30 years. The electricity consumption of a Maryland household in 2050 is unlikely to look like its consumption in 2025. The electrification of transportation, heating, and appliances is not a speculative trend. It is a policy direction embedded in Maryland’s 100% clean energy by 2035 commitment, supported by federal incentive structures, and already underway across the state’s housing stock.
The load additions most commonly encountered in Maryland residential design conversations include the following.
Electric vehicles represent the most significant discrete load addition most households will add. A typical EV charged primarily at home adds 2,000 to 4,000 kWh of annual consumption depending on vehicle efficiency and miles driven. A household with two EVs may add 6,000 to 8,000 kWh annually, a 50 to 70 percent increase over the average Maryland household’s current baseline consumption. A system sized to today’s usage without accounting for a planned or anticipated EV purchase will be undersized from the moment the vehicle arrives.
Heat pump conversion replaces gas or oil heating with electric resistance or heat pump technology. In Maryland’s climate, a whole-home heat pump conversion typically adds 3,000 to 6,000 kWh of annual consumption depending on home size, insulation quality, and equipment efficiency. Homes currently served by BGE’s dual gas-and-electric service are natural candidates for this transition as gas delivery rates continue to climb. A system designed around electric-only consumption that does not account for a future gas-to-electric heating conversion will require expansion.
Induction cooking and electric appliances individually add modest load but collectively can shift a household’s consumption profile meaningfully, particularly in homes replacing high-use gas appliances with electric equivalents.
Home additions, pool installations, and basement finishing add square footage and associated base load. A family that anticipates a home addition within the system’s lifetime is designing against a consumption target that will grow.
Remote work patterns have structurally shifted daytime electricity consumption upward for a significant portion of Maryland households since 2020. A household where one or more members work from home consistently uses more daytime electricity than the same household in a traditional commuting pattern, a difference that also affects how solar production and consumption interact hour by hour.
The design conversation that accounts for these variables produces a system recommendation that serves the home across its actual expected use, rather than one that optimizes for the current snapshot. That conversation requires asking questions that most proposals do not ask. Its absence from a proposal is worth noting.

Roof Geometry and Layout Optimization
Orientation and Tilt
A solar panel’s output is determined not just by its specifications but by where and how it is mounted. Orientation (the compass direction a roof face points) and tilt (the angle at which panels are mounted relative to horizontal) together determine how much of Maryland’s available solar resource a given roof surface can capture.
In Maryland, a south-facing roof surface at a pitch of approximately 20 to 35 degrees captures the greatest annual solar energy. East and west-facing surfaces capture less, typically 15 to 20 percent less than an equivalent south-facing installation, but remain viable for residential systems, particularly when the home has limited south-facing area. North-facing surfaces produce materially less than any other orientation and are generally excluded from system layouts unless roof space constraints make their inclusion necessary to meet a production target.
Proposals that place panels on multiple roof faces with different orientations must account for the production difference between those surfaces in their modeling. A layout that combines south-facing and east-facing panels on a single string without module-level power electronics introduces production constraints, as the lower-producing east-facing panels affect the output of the higher-producing south-facing panels they are strung with. Inverter architecture selection (covered in the inverter section) directly interacts with this design constraint.
Setbacks, Pathways, and Code Compliance
Maryland residential solar installations are subject to code requirements that constrain where panels can be placed on a roof, regardless of the available surface area. These requirements exist primarily to ensure safe access for firefighters during emergency response.
Standard requirements across most Maryland jurisdictions include ridge setbacks (a minimum distance from the roof peak, typically 18 inches), edge setbacks from eave and rake edges, and continuous access pathways across the roof surface that allow emergency personnel to move from eave to ridge without obstruction. On a complex roof with multiple faces, dormers, skylights, and valleys, these pathway requirements can significantly reduce the usable panel area relative to the total roof surface.
Proposals that do not account for these setbacks in their panel count are overstating available roof area. A layout that appears to maximize panel count but cannot pass inspection as designed is not a final layout. It is a preliminary sketch. The distinction matters because the production estimate is built on the panel count, and a panel count that gets reduced at permitting reduces the projected production accordingly.
Local code variation is also relevant. Maryland’s 24 jurisdictions do not apply identical standards. Some counties follow the International Fire Code setback requirements precisely. Others apply local amendments. Installer familiarity with the applicable jurisdiction’s specific requirements is a component of design quality.
Production Modeling Integrity
A solar proposal’s kilowatt-hour production estimate is the output of a computer model. That model produces a number (annual projected production) that becomes the basis for every downstream financial calculation: bill savings, SREC income, payback period, and lifetime return. The integrity of that number determines whether those calculations are reliable.
Understanding how production models work, and where optimistic assumptions are most commonly introduced, is one of the most practically useful things a homeowner can know before evaluating a proposal.
How Production Models Work
Residential solar production estimates are generated using software, commonly PVWatts (produced by the National Renewable Energy Laboratory) or more detailed simulation tools like System Advisor Model. These tools take site-specific inputs and apply them against historical irradiance datasets to produce an estimated annual production figure.
The primary inputs are:
System size in kilowatts DC: the nameplate capacity of the panels installed.
Location-based irradiance data: typically derived from Typical Meteorological Year datasets that represent average solar resource conditions for a given location based on historical records. TMY data reflects average conditions, not best-case conditions.
Panel tilt and orientation: which determines how much of the available irradiance the array captures.
System losses: a composite derate factor that accounts for inverter efficiency, wiring losses, soiling, mismatch between panels, and other real-world performance reductions. The default system loss factor in PVWatts is 14.08%, representing a reasonable aggregate of these effects under standard conditions.
Shading losses: reductions in production caused by obstructions that block sunlight from reaching the panels.
Degradation: the annual reduction in panel output over the system’s life.
Each of these inputs can be set conservatively or optimistically. The production estimate a homeowner receives reflects the cumulative effect of every assumption made across all of these inputs.

Where Optimistic Modeling Most Commonly Occurs
Shading loss understatement is the most frequent source of production overestimation in residential proposals. Shading analysis can be performed at several levels of rigor: a visual assessment during a site visit, a satellite-based tool that estimates shading from overhead imagery, or a LiDAR-based analysis that uses three-dimensional terrain and structure data to model sun angles and shadow paths across every hour of the year. The last method is the most accurate and the least commonly used in standard proposal generation.
Seasonal shading is particularly susceptible to understatement. A tree that appears not to shade a roof in August (when the sun is high in the sky) may cast significant shade across panels in December, when the sun angle drops to 25 to 30 degrees above the horizon. A shading analysis conducted or modeled under summer conditions only will miss this effect entirely.
System loss factors set below the standard default understate the real-world gap between nameplate capacity and actual production. A proposal that uses a 10% system loss factor rather than the standard 14% will project production that is approximately 4 to 5 percent higher than a model using standard assumptions, a difference that compounds across 25 years into a meaningful overstatement of lifetime production and financial return.
Degradation assumptions affect long-term production projections. Panels degrade at rates between 0.25% and 0.55% annually depending on cell technology and manufacturer. A model that applies a 0.25% annual degradation rate to a panel that historically degrades at 0.45% will overstate year 20 and year 25 production. Over a 25-year horizon, the cumulative difference is material.
Snow and soiling losses are sometimes excluded from models entirely. In Maryland’s climate, snow accumulation reduces winter production: modestly in most years, more significantly in heavy snowfall winters. Panel soiling from pollen, dust, and organic matter reduces production year-round at a rate that varies with cleaning frequency and local conditions. Both are real losses that belong in a complete model.
Temperature derating reflects the reduction in panel output as cell temperature rises above the standard test condition of 25°C. Maryland summers produce genuine heat. A system modeled without adequate temperature derate applied to summer production will overstate warm-weather output.
Conservative Versus Aggressive Modeling
The practical test for production model integrity is whether the inputs reflect documented, standard assumptions or whether they have been adjusted in ways that increase the projected production number, and whether those adjustments are disclosed and justified.
A homeowner evaluating a proposal can request the modeling inputs (the system loss factor, the shading derate applied, the degradation rate assumed, and the irradiance dataset used) and compare them against the standard defaults. Inputs that deviate significantly from standard values in the direction of higher production warrant an explanation. Proposals that do not disclose these inputs at all are not providing the information necessary to evaluate the reliability of their production estimate.
The production estimate is the foundation of the financial case. A proposal that presents an optimistic production estimate to make a marginal project appear economically viable is not serving the homeowner’s interests. A proposal built on conservative, documented assumptions that produces a lower but more reliable projected return is a more honest and more useful document.
Electrical Infrastructure and Interconnection
System design does not end at the roof. A complete design accounts for the home’s existing electrical infrastructure and what, if anything, needs to be upgraded to accommodate the system.
The main service panel is the most common constraint. A home with a 100-amp service panel may require an upgrade to 200 amps to accommodate a solar system, particularly if battery storage or EV charging is included in the design. That upgrade carries a cost that should be included in the proposal’s total installed price, not introduced after signing as a change order.
Interconnection requirements vary by utility territory. Each Maryland utility has its own application process, technical review standards, and timeline for approving residential interconnection. The size of the system, the configuration of the inverter, and the capacity available on the local distribution circuit all affect the interconnection outcome. A system designed without reference to the applicable utility’s interconnection requirements may require redesign after the application is submitted, a delay that pushes the installation timeline and may affect incentive eligibility.
In Most Maryland Residential Systems
System design is the variable with the greatest influence on whether a residential solar installation performs as projected over its lifetime. Equipment selection operates within a narrow performance band across reputable manufacturers. Design quality does not.
The questions most worth asking of any proposal are whether the production estimate is based on a 12-month consumption analysis, what shading methodology was used and at what level of rigor, what system loss factors and degradation rates the model applies, and whether the system size accounts for anticipated load changes over the ownership horizon.
Overall project economics are determined more by the accuracy of the design and the reliability of the production model than by any equipment specification.
→ See also: Performance Modeling — Panels — Inverters — Batteries — Utility Rate Structures — Financial Structures
What to Look At
Whether the proposal is based on 12 months of actual utility consumption data rather than an estimate or average. The shading analysis methodology and whether it accounts for seasonal sun angle variation. The system loss factor applied in the production model and how it compares to the NREL standard default. The degradation rate assumption and whether it matches the warranted degradation of the specified panel. Whether future load additions were discussed and whether the system size reflects them. Whether electrical upgrade costs, if required, are included in the quoted price.
What Often Gets Overemphasized
Panel brand and wattage in isolation from the production model that determines how those panels perform in the specific installation. Offset percentage as a headline target without disclosure of the assumptions behind the production estimate that generates it. First-year production figures without disclosure of the degradation curve applied to years 10, 20, and 25. Aesthetic panel layout considerations in proposals where shading and orientation analysis have not been completed at an adequate level of rigor.