


Who Pepco Serves
Pepco serves approximately 582,000 residential and commercial customers in Montgomery County and Prince George’s County — Maryland’s two most populous counties, located immediately adjacent to Washington, D.C.
Like BGE, Pepco is a subsidiary of Exelon Corporation, acquired as part of Exelon’s 2016 purchase of Pepco Holdings. The two utilities share a parent company but operate as separate regulated entities with distinct rate structures and infrastructure programs.
Rate Structure and Recent History
Pepco’s rate structure follows the same supply-plus-delivery framework as other Maryland utilities, but with one meaningful distinction: Pepco operates on seasonal rate schedules, with separate pricing for summer months (June through October) and winter months (November through May).
Pepco’s Maryland residential supply rate as of 2025–2026 sits at approximately 13.25 cents per kWh, among the higher supply rates in the state. The summer 2025 period brought a notable adjustment, with average residential customers seeing a monthly bill increase of approximately $20.81 — a 17.7% jump — driven primarily by elevated PJM capacity costs flowing through for the first time at their full post-auction level.
On the delivery side, Pepco filed a rate case in November 2025 proposing further distribution rate increases of approximately 23% overall, with summer rates proposed to rise 15% and winter rates 33%. That proceeding is subject to Public Service Commission review.
The pattern mirrors what BGE customers have experienced, though the specific drivers differ slightly by territory. Pepco’s service area includes some of the densest and fastest-growing corridors in the DMV region, including Bethesda, Silver Spring, Rockville, and Bowie — areas where infrastructure investment needs are substantial and data center-driven load growth adds long-term demand pressure to the regional grid.
Pepco Rate Comparison: 2021 vs. 2025
The table below is based on actual Pepco residential bills from the same customer account, four years apart.
| May 2021 (950 kWh) | June 2025 (950 kWh) | |
| Supply charge | 7.15¢/kWh | 12.07¢/kWh |
| Delivery charge | 6.06¢/kWh | 11.83¢/kWh |
| All-in rate | ~13.2¢/kWh | ~23.9¢/kWh |
| Monthly bill (new charges) | $125.40 | $227.05 |
The all-in rate increased approximately 81% between May 2021 and June 2025. Both components drove the increase — supply roughly doubled, and delivery charges nearly doubled as well.
At the 2025 rate, the same 950 kWh used in the 2021 bill would cost approximately $227.05 today — an increase of more than $100 per month on identical usage.
Pepco Rate Trajectory: The Forward Picture
Pepco filed a rate case in November 2025 proposing an overall distribution rate increase of approximately 23% — 15% on summer rates and 33% on winter rates. Maryland Matters That proceeding is subject to Public Service Commission review and has not yet been approved as of early 2026.
Even without that increase, Pepco customers are already paying all-in rates that represent a near-doubling from 2021 levels. The trajectory since 2016 — when Exelon completed its acquisition of Pepco Holdings — has been consistent upward movement in the delivery component, layered with supply-side volatility driven by wholesale market conditions.
For homeowners evaluating solar, this rate environment is directly relevant to system economics. The higher the all-in rate, the greater the per-kilowatt-hour offset value of self-generated solar electricity. At current Pepco rates, a 30 kWh day of solar production offsets approximately $6.90–$7.50 in electricity costs — compared to roughly $3.96 at 2021 rates.
Quick Reference: Pepco Residential Electricity Rates
Current supply rate (Standard Offer Service): 13.25¢/kWh — summer 2025 rate; winter 2025–2026 supply rate 10.93¢/kWh
Distribution (delivery) energy charge: ~9.07¢/kWh summer (June–October) | lower winter rate in effect November–May
Customer charge: $8.44/month (per June 2025 bill)
EmPOWER Maryland charge: 1.379¢/kWh (per June 2025 bill)
Montgomery County Energy Tax: 1.132¢/kWh (Montgomery County customers)
Prince George’s County Energy Tax: 0.959¢/kWh (Prince George’s County customers)
Franchise tax: 0.062¢/kWh
Estimated all-in average: ~23–25¢/kWh summer | ~21–23¢/kWh winter Price to Compare (June 2025 bill): 12.49¢/kWh
Proposed rate case (filed November 2025): +23% overall on delivery; +15% summer, +33% winter — pending PSC approval as of February 2026
Rate sources: Pepco Maryland tariff filings, Maryland Office of People’s Counsel, actual customer bills (May 2021 and June 2025)
Supply rates adjust semiannually. Delivery rates subject to pending PSC proceedings. Page last verified: February 2026.
What This Means for Solar
Pepco customers currently face some of the highest all-in electricity rates among Maryland’s major utilities. That rate environment creates a strong financial baseline for residential solar, particularly for homeowners with above-average electricity usage or properties well-suited to solar production.
Pepco-specific considerations:
Net metering under Pepco follows Maryland’s standard framework. Credits are applied at the retail rate, roll over monthly, and settle annually. Pepco observes the same seasonal rate distinctions in its supply pricing, which means credits earned during high-rate summer months carry more offset value than those earned in winter.
Interconnection at Pepco has historically been functional for standard residential systems, with most applications processed through the expedited pathway.
Pepco customers are eligible for Maryland’s SREC program and the full state and federal incentive stack.
Are Pepco Customers a good fit for solar?
Pepco’s Montgomery and Prince George’s county service area represents one of the strongest economic environments for residential solar in the state. High rates, suburban density, and a mix of property types that include many rooftops well-suited to solar combine to make this a productive territory.
The primary limiting factors are the same ones that apply everywhere: shading, usage levels, structural constraints, and HOA restrictions in communities where they exist. Montgomery County in particular has a higher density of HOA-governed communities than other parts of the state, which can introduce restrictions on visible solar installations depending on the specific association’s rules.
For properties that qualify, the combination of Pepco’s current rate levels and the state incentive structure produces one of the more compelling financial cases in Maryland.
Rate data sourced from Pepco Maryland tariff filings, Maryland Office of People’s Counsel, and customer billing records. Supply rates adjust semiannually. Delivery rates are subject to pending PSC proceedings.
Who BGE Serves
BGE serves approximately 1.3 million electric customers across Baltimore City and ten surrounding counties in Central Maryland — including Anne Arundel, Carroll, Harford, Howard, and portions of Baltimore County. It is one of the oldest utility companies in the country and the largest utility in Maryland by customer count.
BGE is a subsidiary of Exelon Corporation, the Chicago-based utility holding company that also owns Pepco and Delmarva Power. Exelon acquired BGE as part of its legacy structure and expanded its Maryland footprint when it purchased Pepco Holdings in 2016.
Current BGE Residential Rate (2025–2026)
Like every Maryland utility, BGE’s residential bill is built from two separate charge categories: supply and delivery. Both have risen significantly, and both require explanation.
Supply charge (Price to Compare): BGE’s residential supply rate was set at 13.45¢ per kWh through February 28, 2026, at which point it increases again on March 1, 2026 — a reset that OPC noted will push supply costs higher for the spring billing period. BGE’s supply rates adjust multiple times per year based on wholesale procurement cycles.
Delivery charge (distribution): BGE’s electric distribution rate reached approximately 4.9¢ per kWh in 2025 under its second multi-year rate plan, with a further increase to approximately 5.5¢ per kWh effective January 1, 2026 — the final approved step under BGE’s current MRP. A new rate case must be filed before 2027.
All-in average residential rate: When delivery, supply, transmission, EmPOWER Maryland charge, Gross Receipts Tax, customer charge, and other line items are combined, BGE customers are currently paying approximately 23–26¢ per kWh all-in, depending on usage level and season. For a household using 1,000 kWh per month, that translates to a monthly electricity bill in the range of $230–$260 before any gas charges.
Rate Structure and Recent History
BGE bills residential customers through two primary components: an energy supply charge and a delivery charge. Both have increased significantly over the past several years.
On the supply side, BGE’s residential energy rate is procured through periodic wholesale auctions and adjusts seasonally. As of summer 2025, BGE’s residential energy rate sat at approximately 11.4 cents per kWh — a figure that reflects the elevated wholesale costs of recent procurement cycles, including the impact of the 2024 PJM capacity auction.
On the delivery side, the picture is more dramatic. BGE’s delivery charges have increased substantially since Exelon’s consolidation of Mid-Atlantic utilities in 2016. Delivery costs that once ran around 4.65 cents per kWh now exceed 11.8 cents per kWh — a near-tripling driven by infrastructure investment programs, grid modernization spending, and the financing costs associated with sustained capital deployment.
The combined effect on total residential bills has been significant. BGE customers saw some of the steepest rate increases among Maryland utilities in recent years, prompting formal intervention from the Maryland Office of People’s Counsel and legislative scrutiny of the utility’s infrastructure spending program, known as “Operation Pipeline.” As of early 2025, BGE reported that residential customers collectively carried more than $170 million in arrears — a figure that reflects the real affordability pressure on households in the territory.
The 2025 Maryland legislative session authorized a one-time bill credit program to offset some of the summer 2025 impact, with eligible residential customers expected to receive approximately $40 in credits for both summer and winter billing periods.
BGE Rate Comparison: 2021 vs. 2025–2026
The table below compares actual line-item rates from a real BGE residential bill dated April 2021 against current BGE tariff rates.
| Component | April 2021 (actual bill) | 2025–2026 (current tariff) | Change |
| Supply (SOS) | 7.053¢/kWh | 11.69–13.45¢/kWh | +66–91% |
| Distribution charge | 3.327¢/kWh | ~5.5¢/kWh | +65% |
| EmPOWER MD charge | 0.594¢/kWh | ~1.38¢/kWh | +132% |
| Customer charge | $8.00/month | Higher | Increased |
| Estimated all-in rate | ~11.57¢/kWh | ~23–26¢/kWh | +99–125% |
The same 1,586 kWh used in that April 2021 bill — which produced a $183.55 electric charge — would cost approximately $365–$412 at current rates. That is roughly double, on identical usage.
What’s Driving the Increase
BGE’s rate trajectory is the product of three overlapping forces, each operating on a different timeline.
The delivery side: Operation Pipeline and the Multi-Year Rate Plan
BGE is a dual-service utility — it provides both electricity and gas to Central Maryland customers. Its delivery rate increases have been shaped heavily by infrastructure investment programs authorized under Maryland’s STRIDE law, which allowed utilities to recover capital spending through an expedited rate mechanism rather than the traditional rate case process.
BGE’s electric delivery rates have doubled since 2010, and its gas delivery rates have tripled over the same period. BGE profits grew from $147 million in 2010 to $578 million in 2025 — nearly quadrupling under Exelon’s ownership. Maryland OPC
The mechanism enabling this is BGE’s Multi-Year Rate Plan structure. Multi-year rate plans allow utilities to request rate increases in advance of actual spending rather than defending expenditures after the fact — a structure that critics argue increases the financial incentive for utilities to spend aggressively, since the more BGE spends, the larger the asset base on which it earns a regulated return. EnergyChoiceMatters
BGE’s current MRP runs through the end of 2026, at which point a new rate case must be filed. Customers should expect that proceeding to be closely watched by consumer advocates.
The supply side: PJM capacity markets and procurement timing
BGE electric supply rates went up by roughly 25% in September 2024 alone. Maryland OPC That increase was driven primarily by the 2024 PJM capacity auction, which cleared at record prices. The 2025/2026 capacity market added approximately $16 per month to the average BGE residential bill Bge — the highest dollar impact of any Maryland utility. BGE customers bore a larger absolute dollar increase than Pepco or Delmarva customers because BGE’s territory is larger and its customer base faces the same PJM capacity pricing shock on top of already-elevated delivery charges.
PJM’s decision not to count the output of two active power plants in their supply pool caused as much as 65% of BGE bill increases seen in 2025. After pushback from consumer advocates, PJM changed that policy for 2026. EnergyChoiceMatters The adjustment is expected to provide some supply cost relief going forward, though it does not unwind the rate increases already absorbed by customers.
The transmission component: an overlooked driver
A third, less visible factor is the steady rise in transmission costs across the PJM grid. Transmission costs have doubled across PJM over the past 10 years. Bge These costs flow through to customers as part of the supply charge and have increased BGE’s total SOS rate incrementally each year, compounding the impact of supply and delivery increases.
Is BGE Raising Rates in 2026?
Yes — in two confirmed steps. On January 1, 2026, BGE’s electric distribution rate increased by 0.1 cents per kWh, and its gas distribution rate increased by 4.2 cents — the final step under BGE’s current multi-year rate plan. The PSC also approved a reconciliation increase in December 2025 — roughly half of BGE’s $152 million request — which will add a further 0.1 cents per kWh to electric rates for approximately two years to recover prior overspending during BGE’s first MRP cycle. The BayNet
Supply rates are also set to increase again on March 1, 2026, per OPC’s published guidance.
BGE has indicated it will file a new rate case before the end of 2026 to establish rates for 2027 and beyond. That proceeding will be another significant moment for Central Maryland customers evaluating long-term energy costs.
Quick Reference: BGE Residential Electricity Rates
Current supply rate (SOS): 13.45¢/kWh through May 31, 2026; increases June 1, 2026
Winter supply rate (Oct 2025 – Feb 2026): 11.69¢/kWh
Summer supply rate (Jun – Sep 2025): 11.42¢/kWh
Electric distribution rate (2026): ~5.5¢/kWh
EmPOWER MD charge: ~1.38¢/kWh
Estimated all-in average: ~23–26¢/kWh
Rate sources: BGE Maryland tariff filings, Maryland Office of People’s Counsel, actual customer bill (April 2021)
Supply rates adjust multiple times per year. Delivery rates are governed by BGE’s multi-year rate plan through 2026, after which a new rate case will be filed. Page last verified: February 2026.
What This Means for Solar
BGE’s rate trajectory is one of the clearest financial arguments for residential solar in Central Maryland. When a homeowner’s all-in cost per kilowatt-hour is high and rising, the offset value of self-generated solar electricity is correspondingly high.
A few BGE-specific details are worth knowing before evaluating a project:
Net metering under BGE follows Maryland’s standard framework — solar customers receive credits for exported electricity at or near the full retail rate, with monthly rollover and an annual settlement. However, BGE customers on time-of-use rate schedules are not eligible for net metering under current tariff rules. If you are on a TOU rate, you would need to return to BGE’s standard residential schedule before interconnecting a solar system.
Interconnection processing at BGE has generally been reliable, though timelines can extend during periods of high application volume. Most standard residential interconnections fall within the expedited review pathway.
Is BGE territory a good fit for solar?
BGE customers represent some of the strongest candidates for residential solar in the state, primarily because of the rate environment. High and rising electricity costs create a favorable baseline for system economics, and the state incentive structure — net metering, SRECs, and the federal tax credit — layered on top of that baseline can produce meaningful long-term returns for qualifying properties.
As with any territory, individual results depend on roof orientation, usage profile, shading conditions, and the financing structure chosen. Properties with significant shading, low electricity usage, or structural limitations may still not be viable. But for a well-sited BGE home with average to above-average usage, the economic environment for solar is currently strong.
Potomac Edison Residential Electricity Rates (2021–2025)
For most of the past decade, Potomac Edison customers in Western Maryland paid the lowest electricity rates of any major utility in the state. That gap was real, and it was meaningful — while BGE and Pepco customers were absorbing delivery charge increases tied to Exelon’s infrastructure investment programs after 2016, Potomac Edison customers were largely insulated. FirstEnergy, PE’s parent company, had not filed a major rate case in Maryland since 1994. Delivery charges in Western Maryland stayed relatively flat while the rest of the state climbed.
That period ended.
The rate increases that hit BGE and Pepco customers in 2021 and 2022 arrived in Potomac Edison territory on a slight delay — but they arrived. By 2023, supply rates had moved sharply higher. By 2025, the all-in rate for a Potomac Edison customer had increased roughly 34% from where it stood in late 2021. The cost advantage that once defined this territory has narrowed considerably.
Current Potomac Edison Residential Rate (2025–2026)
Potomac Edison’s bill structure differs slightly from BGE and Pepco in presentation but follows the same fundamental supply-plus-delivery framework.
Supply charge (Standard Offer Service): The SOS rate for summer 2025 was 10.942¢/kWh through September 30, 2025. Beginning October 1, 2025, the SOS rate dropped to 10.202¢/kWh through May 31, 2026 — a modest reduction reflecting improved wholesale procurement conditions for the winter cycle. The weighted average SOS price through May 2026 is approximately 10.449¢/kWh. The next SOS rate reset, covering June 2026 through May 2027, will be set in January 2026.
Delivery charges: Potomac Edison’s variable distribution charge ran approximately 2.29¢/kWh in summer 2025, with a fixed customer distribution charge of $6.00/month. Additional delivery-side line items include the Cogeneration PURPA Project Termination Agreement surcharge ($10.66 on the June 2025 bill), EmPOWER Maryland charge ($12.92), transmission charge, franchise tax, and MD Environmental Surcharge.
Energy Cost Adjustment: PE bills include an Energy Cost Adjustment line that can run positive or negative depending on the period. In the June 2025 bill it added $9.24. In the June 2023 bill it was a credit of -$5.10. This fluctuation is worth noting — it creates some month-to-month variability in the effective all-in rate that doesn’t exist as visibly on BGE or Pepco bills.
All-in average residential rate: Based on the June 2025 bill data, Potomac Edison customers are currently paying approximately 15–17¢/kWh all-in — meaningfully below BGE and Pepco’s 23–26¢/kWh range, but substantially higher than the 11–12¢ range that characterized the territory as recently as 2021.
Perfect. Let me extract everything from all three bills before writing.
2021 bill (Nov 20 – Dec 17, 2021 | 1,206 kWh | New Market, MD):
- Generation charge: $73.99 → 6.136¢/kWh
- Transmission: $4.78 → 0.396¢/kWh
- Distribution: $21.11 → 1.750¢/kWh
- Customer distribution charge: $5.70 (fixed)
- Energy Cost Adjustment: $9.42
- Cogeneration PURPA surcharge: $14.98
- EmPOWER MD: $8.65
- Total: $138.45 → ~11.48¢/kWh all-in
- SOS noted on bill: 312¢/kWhthrough May 31, 2022
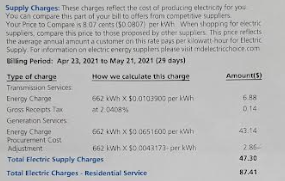
2023 bill (May 23 – Jun 19, 2023 | 2,043 kWh | Ijamsville, MD):
- Generation charge: $159.54 → 7.810¢/kWh
- Transmission: $8.09 → 0.396¢/kWh
- Distribution: $36.75 → 1.799¢/kWh
- Customer distribution: $5.70 (fixed)
- Energy Cost Adjustment: -$5.10
- Total: $219.73 → ~10.75¢/kWh all-in
- SOS noted on bill: 626¢/kWhthrough Sept 30, 2023; climbing to 9.022¢ Oct 2023–May 2024
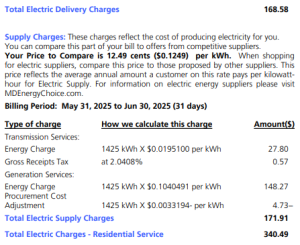
2025 bill (May 28 – Jun 27, 2025 | 1,280 kWh | Hagerstown, MD):
- Generation charge: $124.65 → 9.738¢/kWh
- Transmission: $5.07 → 0.396¢/kWh
- Distribution: $29.27 → 2.287¢/kWh
- Customer distribution: $6.00 (fixed)
- Energy Cost Adjustment: $9.24
- Cogeneration PURPA surcharge: $10.66
- EmPOWER MD: $12.92
- Total consumption charges: $196.48 → ~15.35¢/kWh all-in
- SOS noted on bill: 942¢/kWhthrough Sept 30, 2025; dropping to 10.202¢ Oct 2025–May 2026
The narrative your context provided is confirmed by the bills themselves — the 2021 bill shows PE customers were genuinely sheltered (7.3¢ SOS, modest all-in), the 2023 bill shows the rate shock arriving mid-stride, and 2025 shows the full new normal. Now writing:
Potomac Edison Residential Electricity Rates (2021–2025)
For most of the past decade, Potomac Edison customers in Western Maryland paid the lowest electricity rates of any major utility in the state. That gap was real, and it was meaningful — while BGE and Pepco customers were absorbing delivery charge increases tied to Exelon’s infrastructure investment programs after 2016, Potomac Edison customers were largely insulated. FirstEnergy, PE’s parent company, had not filed a major rate case in Maryland since 1994. Delivery charges in Western Maryland stayed relatively flat while the rest of the state climbed.
That period ended.
The rate increases that hit BGE and Pepco customers in 2021 and 2022 arrived in Potomac Edison territory on a slight delay — but they arrived. By 2023, supply rates had moved sharply higher. By 2025, the all-in rate for a Potomac Edison customer had increased roughly 34% from where it stood in late 2021. The cost advantage that once defined this territory has narrowed considerably.
Current Potomac Edison Residential Rate (2025–2026)
Potomac Edison’s bill structure differs slightly from BGE and Pepco in presentation but follows the same fundamental supply-plus-delivery framework.
Supply charge (Standard Offer Service): The SOS rate for summer 2025 was 10.942¢/kWh through September 30, 2025. Beginning October 1, 2025, the SOS rate dropped to 10.202¢/kWh through May 31, 2026 — a modest reduction reflecting improved wholesale procurement conditions for the winter cycle. The weighted average SOS price through May 2026 is approximately 10.449¢/kWh. The next SOS rate reset, covering June 2026 through May 2027, will be set in January 2026.
Delivery charges: Potomac Edison’s variable distribution charge ran approximately 2.29¢/kWh in summer 2025, with a fixed customer distribution charge of $6.00/month. Additional delivery-side line items include the Cogeneration PURPA Project Termination Agreement surcharge ($10.66 on the June 2025 bill), EmPOWER Maryland charge ($12.92), transmission charge, franchise tax, and MD Environmental Surcharge.
Energy Cost Adjustment: PE bills include an Energy Cost Adjustment line that can run positive or negative depending on the period. In the June 2025 bill it added $9.24. In the June 2023 bill it was a credit of -$5.10. This fluctuation is worth noting — it creates some month-to-month variability in the effective all-in rate that doesn’t exist as visibly on BGE or Pepco bills.
All-in average residential rate: Based on the June 2025 bill data, Potomac Edison customers are currently paying approximately 15–17¢/kWh all-in — meaningfully below BGE and Pepco’s 23–26¢/kWh range, but substantially higher than the 11–12¢ range that characterized the territory as recently as 2021.
Potomac Edison Rate Comparison: 2021 vs. 2023 vs. 2025
The three bills below span the full arc of PE’s rate trajectory — from the tail end of the low-rate era through the arrival of market-driven increases and into the current environment.
| Dec 2021 (1,206 kWh) | Jun 2023 (2,043 kWh) | Jun 2025 (1,280 kWh) | |
| SOS supply rate | 7.312¢/kWh | 8.626¢/kWh | 10.942¢/kWh |
| Distribution charge | 1.750¢/kWh | 1.799¢/kWh | 2.287¢/kWh |
| Estimated all-in rate | ~11.48¢/kWh | ~10.75¢/kWh | ~15.35¢/kWh |
| Total bill (consumption) | $138.45 | $219.73 | $196.48 |
A few things worth noting in this data. The 2023 bill reflects summer usage on a larger home — 2,043 kWh versus 1,206 and 1,280 kWh in the other two periods — which accounts for the higher dollar total despite a lower all-in rate. The rate itself tells the cleaner story: SOS supply climbed from 7.3¢ to 8.6¢ to 10.9¢ across four years, a 50% increase in the supply component alone. The distribution charge, which barely moved between 2021 and 2023, stepped up more noticeably by 2025.
The 2023 bill also carries a notable message in the fine print: it discloses that SOS electricity was set to reach 9.022¢/kWh by October 2023 and climb further to 9.023¢ through May 2024 — with the June 2024 rate to be set later. That forward-looking language on the bill itself signals the moment Potomac Edison customers began to feel what BGE and Pepco customers had already been absorbing for two years.
What’s Driving the Increase
Potomac Edison’s rate trajectory is driven almost entirely by the supply side, which distinguishes it from BGE and Pepco where delivery charge growth has been equally significant.
Supply: the delayed PJM impact
Potomac Edison procures electricity through FirstEnergy’s SOS mechanism, which resets periodically based on wholesale market conditions. The same PJM capacity auction dynamics that drove sharp supply increases at BGE and Pepco in 2022–2023 worked their way into PE’s procurement cycles on a lag. By the time the June 2023 bill was issued, the supply rate had already moved from 7.3¢ to 8.6¢ — and the bill’s own messaging warned customers it was heading higher still.
The 2024 PJM capacity auction — which cleared at record prices — pushed PE’s SOS rate to 10.942¢ for summer 2025, the highest it has been in the territory’s recent history. The October 2025 reset to 10.202¢ represents a modest improvement but still sits roughly 40% above where the supply rate was in late 2021.
Delivery: stable, but no longer flat
Potomac Edison’s delivery charges have not escalated the way BGE’s have. The distribution charge moved from 1.750¢/kWh in 2021 to 2.287¢/kWh in 2025 — a 31% increase, but starting from a much lower base than Exelon-affiliated utilities. The fixed customer charge increased from $5.70 to $6.00 over the same period.
The more notable delivery-side line item is the Cogeneration PURPA surcharge — a charge that appears on PE bills related to legacy power purchase agreements with small independent generators. At $10.66 on the June 2025 bill, it adds a fixed cost that doesn’t scale with usage, meaning lower-usage customers feel it proportionally more than high-usage ones.
The rate advantage: narrowed, not eliminated
Potomac Edison customers are still paying less per kilowatt-hour than BGE or Pepco customers — approximately 15–17¢ all-in versus 23–26¢. That gap remains meaningful in absolute terms. But the trajectory since 2021 has moved in the same direction as the rest of the state, and the insulation that once characterized Western Maryland’s electricity market has worn thin.
What This Means for Solar in Potomac Edison Territory
Three years ago, the financial case for solar in Western Maryland required more explanation than it does today. Potomac Edison’s historically low rates meant the per-kilowatt-hour offset value of solar was modest, and the math was genuinely tighter than in BGE or Pepco territory. That context has shifted.
Since 2021, Potomac Edison’s supply rate has increased approximately 50% — from 7.3¢/kWh to 10.9¢/kWh — driven by the same wholesale market forces reshaping electricity costs across the entire region. Data center expansion in the DMV corridor, accelerating electrification of homes and vehicles, and sustained population growth in Frederick, Washington, and Hagerstown counties have placed persistent upward pressure on PJM’s capacity and generation markets. Those costs flow directly into PE’s SOS rate at each reset cycle. The October 2025 reset provided a modest reduction — from 10.942¢ to 10.202¢ — but that single-cycle dip does not reverse a multi-year structural trend.
The forward-looking picture is not complicated. The same demand drivers that produced a 50% supply rate increase between 2021 and 2025 have not gone away. Data center development continues to expand throughout the Mid-Atlantic. Electrification of heating systems and transportation is accelerating, not slowing. New construction in the I-70 and Route 15 corridors continues to add load to a regional grid that is not adding supply at the same pace. Each of these factors points in the same direction for wholesale electricity costs over the next five to ten years.
For homeowners who look at that trajectory and want to get ahead of it, solar ownership offers something the utility market cannot: a fixed cost of electricity production that does not reset with the next PJM auction. A system installed today locks in a known cost per kilowatt-hour for the next 25 to 30 years. The utility’s SOS rate will reset again in June 2026, and again after that. A solar system’s production cost does not.
This is not an argument that solar works for every property in Western Maryland. Lower all-in rates compared to BGE and Pepco mean the baseline economics are less forgiving, and individual variables — usage level, roof orientation, shading, and financing structure — carry more weight in the analysis here than they do in higher-rate territories. A property that is marginal at 16¢/kWh may look considerably different at 20¢/kWh, which is a scenario the current rate trajectory makes plausible within the next few years.
What has changed is who is asking the right question. In 2021, solar in PE territory was a longer-term bet on rate increases that hadn’t arrived yet. In 2025, those increases have already arrived — and the structural conditions that produced them are still in place. Homeowners who understand the rate environment and are evaluating solar now are not speculating about future increases. They are looking at four years of documented evidence and deciding whether to act before the next cycle hits.
Quick Reference: Potomac Edison Residential Electricity Rates
Current SOS supply rate: 10.202¢/kWh (Oct 1, 2025 – May 31, 2026)
Prior summer SOS rate: 10.942¢/kWh (through Sept 30, 2025)
Weighted average SOS through May 2026: ~10.449¢/kWh
Variable distribution charge (2025): ~2.287¢/kWh
Fixed customer distribution charge: $6.00/month
Cogeneration PURPA surcharge: $10.66/month (fixed, per June 2025 bill)
EmPOWER MD charge: ~$12.92/month (per June 2025 bill)
Estimated all-in average: ~15–17¢/kWh
Rate sources: Potomac Edison (FirstEnergy) tariff filings, actual customer bills (December 2021, June 2023, June 2025)
SOS supply rates reset semiannually. Next reset: June 1, 2026, rate to be set January 2026. Page last verified: February 2026.
Delmarva Power Residential Electricity Rates (2021–2026)
Delmarva Power customers on Maryland’s Eastern Shore have experienced some of the most significant electricity rate increases in the state over the past several years — and unlike BGE or Pepco, where the increases have drawn sustained public and legislative attention, the story of what happened to Eastern Shore electricity bills has received comparatively little scrutiny. The numbers, however, are clear.
Delmarva Power’s distribution rate has increased from 3.2¢/kWh to 7.0¢/kWh since 2010 Maryland Matters — more than doubling over fifteen years under Exelon’s ownership. That trajectory mirrors what BGE and Pepco customers experienced, which is not a coincidence. All three utilities share the same parent company, the same Multi-Year Rate Plan structure, and the same pattern of pre-approved infrastructure investment recovery flowing through to customer bills on a scheduled basis.
The February 2026 bill from a Dorchester County customer tells the current story directly.
Current Delmarva Power Residential Rate (2026)
Delmarva’s bill structure follows the standard Exelon format — supply and delivery presented as separate categories, with several line items within each.
Supply charge (Standard Offer Service): Delmarva’s current SOS rate is 12.09¢/kWh through May 31, 2026. Pepco The February 2026 bill reflects the SOS and transmission combined rate of 12.074¢/kWh, plus a Procurement Cost Adjustment of 0.898¢/kWh — bringing the effective supply cost to approximately 12.97¢/kWh. The Price to Compare listed on the bill is 12.02¢/kWh, which represents the annual weighted average supply cost used for comparison purposes.
Delivery charge (distribution): Delmarva’s current distribution rate is 6.63¢/kWh — applied uniformly across all usage. This is substantially higher than Potomac Edison’s 2.29¢/kWh and meaningfully higher than BGE’s 5.5¢/kWh, making Delmarva’s delivery component one of the most expensive among Maryland’s major utilities on a per-kWh basis.
EmPOWER Maryland charge: At 2.006¢/kWh, Delmarva’s EmPOWER Maryland charge is the highest of any Maryland utility documented here — nearly double BGE’s 1.38¢/kWh and significantly above Pepco’s rate. On a 2,068 kWh winter bill, this single line item totaled $41.48. It is a state-mandated charge, not a Delmarva-controlled one, but it appears on Delmarva bills at a higher rate than elsewhere and contributes meaningfully to the all-in cost.
MYP Adjustment: The February 2026 bill includes a small MYP Adjustment credit of -0.026¢/kWh. The presence of this line item confirms Delmarva is operating under its Multi-Year Rate Plan, approved by the Maryland PSC in December 2022. Delmarva Power’s last rate case was in 2022 and was a multi-year rate case, with the PSC order issued December 14, 2022. Bge Delivery rate increases under that plan are scheduled and pre-approved — they do not require a new rate case to take effect.
All-in average residential rate: Based on the February 2026 bill data — 2,068 kWh, winter rates, Dorchester County — the all-in rate works out to approximately 22.0¢/kWh. At current rates, that places Delmarva customers in similar territory to Pepco customers, and well above Potomac Edison.
What Happened to Delmarva Rates: The Exelon MYP Effect
Delmarva Power became an Exelon subsidiary when Exelon acquired Pepco Holdings in 2016 — the same transaction that brought Pepco under the Exelon umbrella. Before that acquisition, Delmarva’s rate trajectory was more modest. In the years that followed, the utility filed for and received approval of Multi-Year Rate Plans that authorized sustained delivery charge increases tied to infrastructure investment programs.
Delmarva Power’s distribution rates more than doubled from 3.2¢/kWh to 7.0¢/kWh between 2010 and 2024. Maryland Matters The current bill shows 6.63¢/kWh — consistent with that trajectory and likely to increase further when Delmarva’s current MYP cycle concludes and a new rate case is filed.
On the supply side, Delmarva customers absorbed the same PJM capacity auction shock that hit every Maryland utility in 2024–2025. The Procurement Cost Adjustment on the February 2026 bill — adding 0.898¢/kWh on top of the base SOS rate — reflects the true-up mechanism that ensures Delmarva recovers its full wholesale procurement cost. In periods where capacity prices spike, that adjustment runs positive and adds to the bill. In periods where procurement came in below forecast, it can run as a credit.
The combined effect of delivery charge escalation and supply-side market repricing has produced all-in rates on the Eastern Shore that most customers would not have anticipated a decade ago.
A Note on Geography and Grid Infrastructure
Delmarva Power’s service territory has a structural characteristic that distinguishes it from every other Maryland utility: it is physically separated from the rest of the state by the Chesapeake Bay.
The Eastern Shore is connected to the broader PJM grid through a limited number of transmission corridors — primarily the cross-bay transmission lines that tie the peninsula into the broader Mid-Atlantic network. This geographic constraint has historically created higher transmission costs in the territory and can create hosting capacity limitations in specific areas that affect solar interconnection timelines and feasibility.
It also means that local grid investment on the Shore — substations, distribution upgrades, storm hardening for a territory that faces more severe coastal weather exposure than inland Maryland — is reflected in Delmarva’s delivery charges without the density of customer base that BGE or Pepco have to spread those costs across. Eastern Shore customers bear a relatively higher per-customer infrastructure cost than their counterparts in Baltimore or Montgomery County, and that is embedded in the 6.63¢/kWh distribution rate.
What This Means for Solar in Delmarva Territory
At 22¢/kWh all-in, Delmarva customers are paying rates that sit alongside Pepco and approach BGE — and unlike those urban and suburban territories, the Eastern Shore has not seen the same volume of solar adoption that might suggest the opportunity is already well-captured.
The rate environment creates a strong financial baseline. A solar system offsetting electricity at 22¢/kWh generates meaningful bill credits under net metering, and Delmarva customers are eligible for the full Maryland incentive stack — SRECs, the federal Investment Tax Credit, and net metering at the retail rate.
The geographic and structural variables that matter most here are different from Central Maryland. Tree coverage on rural and waterfront properties, older roof stock in some Eastern Shore communities, and the transmission constraints that can affect interconnection timelines in certain areas are the primary factors that determine individual project viability. Community solar is also worth noting as an alternative — for Eastern Shore customers whose properties are not well-suited to rooftop installation, off-site community solar subscriptions have been actively developed in this territory and allow bill credits without any on-site installation.
For properties that qualify, the economics at current Delmarva rates are competitive with any territory in the state.
Quick Reference: Delmarva Power Residential Electricity Rates
Current SOS supply rate: 12.09¢/kWh through May 31, 2026 Effective supply rate (with Procurement Cost Adjustment): ~12.97¢/kWh (per Feb 2026 bill) Price to Compare (annual weighted average): 12.02¢/kWh Distribution charge: 6.63¢/kWh (winter 2026) EmPOWER Maryland charge: 2.006¢/kWh — highest among Maryland’s major utilities Customer charge: $9.43/month (fixed) Estimated all-in average: ~22¢/kWh (winter); higher in summer Rate sources: Delmarva Power tariff filings, Maryland Office of People’s Counsel, actual customer bill (February 2026, Dorchester County)
SOS supply rates reset semiannually. Current rate effective through May 31, 2026. Delivery rates governed by Multi-Year Rate Plan approved December 2022. Page last verified: February 2026.
SMECO Residential Electricity Rates (2021–2025)
SMECO — the Southern Maryland Electric Cooperative — is the only member-owned electric cooperative among Maryland’s major utilities. That distinction is not just organizational. It shapes how rates are set, how cost increases flow through to members, and why the explanation for what happened to SMECO bills between 2021 and 2025 is fundamentally different from the explanation for BGE or Pepco.
The short version: SMECO members saw their SOS supply rate nearly double in four years. Unlike BGE or Pepco, where delivery charge escalation driven by investor-owned infrastructure programs accounts for a significant share of rate increases, SMECO’s delivery charges have remained comparatively stable. The increase that hit Southern Maryland members came almost entirely from the wholesale electricity market — a market SMECO does not control, does not mark up, and passes through to members at cost.
That distinction matters for understanding the bill. It also matters for evaluating solar.
Current SMECO Residential Rate (2025–2026)
SMECO’s bill structure differs visibly from the Exelon-affiliated utilities. The supply side is presented in two components — a flat base Energy Charge and a variable Power Cost Adjustment — which together make up the total SOS rate. The delivery side carries SMECO-specific line items including a Bill Stabilization Adjustment that functions as a partial offset to distribution costs.
Supply charge (Standard Offer Service): SMECO’s total residential SOS rate was 10.9408¢/kWh in June 2025. Maryland OPC The July 2025 SOS rate was 10.8758¢/kWh. Dcpsc The September 2025 bill in hand shows 11.0492¢/kWh — the highest point in the current rate cycle. The current base energy rate was revised upward effective June 1, 2025 after the Power Cost Adjustment triggered the filing threshold for three consecutive months. As of February 2026, SMECO’s Price to Compare is approximately 10.5729¢/kWh The BayNet — the supply rate a member would use to compare against third-party suppliers.
Power Cost Adjustment: The PCA is a variable line item that runs positive or negative depending on whether SMECO’s actual wholesale costs came in above or below the base rate forecast. In the 2021 bill it ran as a credit of -0.3227¢/kWh. By the time the 2025 rate filing was triggered, the PCA was running 17.43% greater than the base SOS rate Maryland Matters — meaning wholesale costs had materially outpaced the flat base rate that members were being billed.
Distribution charge: 4.3¢/kWh in 2021, modestly higher by 2025. The Bill Stabilization Adjustment — a credit line item — partially offsets distribution costs and functions as SMECO’s mechanism for smoothing delivery charges across the membership.
EmPOWER Maryland charge: 0.986¢/kWh in 2021, increasing to approximately 1.03¢/kWh by 2025 per the bill on file. Notably lower than Delmarva’s 2.006¢/kWh on the same state-mandated charge.
Prince George’s County Energy Tax: Applies to members served in PG County portions of SMECO’s territory. Visible as a separate line item on the September 2025 bill. Members in Calvert, Charles, and St. Mary’s counties do not carry this charge.
All-in average residential rate: Based on the September 2025 bill — 404 kWh, summer rates, Brandywine — the all-in rate works out to approximately 24.3¢/kWh. That figure reflects a summer billing period on a lower-usage month, where fixed charges like the Facilities Charge carry more weight per kWh. For higher-usage billing periods, the all-in rate moderates slightly. Across the full year, SMECO members at average usage are paying approximately 20–22¢/kWh all-in.
SMECO Rate Comparison: 2021 vs. 2025
| May 2021 (1,081 kWh) | Sep 2025 (404 kWh) | Change | |
| SOS supply rate | 5.787¢/kWh | 11.049¢/kWh | +91% |
| Power Cost Adjustment | -0.323¢/kWh | +0.497¢/kWh | Swung positive |
| Distribution charge | 4.3¢/kWh | ~4.5¢/kWh | Modest increase |
| EmPOWER MD charge | 0.986¢/kWh | ~1.03¢/kWh | Minor increase |
| Estimated all-in rate | ~11.52¢/kWh | ~24.3¢/kWh | +111% |
| Total bill | $124.51 | $98.01 (256 budget) | Usage-dependent |
The supply rate alone increased 91% between May 2021 and September 2025. The Power Cost Adjustment swung from a bill credit to a positive charge — meaning members went from paying slightly less than the base rate to paying meaningfully more. The delivery side, by contrast, barely moved. That asymmetry is the defining characteristic of SMECO’s rate trajectory and the key to understanding why Southern Maryland members saw such dramatic bill increases without any of the infrastructure-investment narrative that explains BGE and Pepco’s delivery charge escalation.
Why Did SMECO’s Rates Increase So Much? The Cooperative Difference
This is where SMECO’s story diverges most sharply from the other utilities on this page — and where understanding the cooperative model is essential to understanding the bill.
BGE and Pepco are investor-owned utilities. Their rate increases reflect a combination of wholesale market costs and infrastructure investment recovery — with the latter driven by management decisions about capital deployment, approved by regulators, and structured to generate a return for shareholders. When BGE’s delivery charges double, that increase flows from deliberate investment programs whose costs are embedded in multi-year rate plans.
SMECO operates differently. It is a nonprofit cooperative owned by its members. It does not have shareholders. It does not earn a profit on capital deployed. Its delivery infrastructure is not being expanded at the pace of BGE or Pepco, and its delivery charges reflect that. The distribution charge that was 4.3¢/kWh in 2021 is still roughly 4.3–4.5¢/kWh in 2025 — essentially flat.
What SMECO cannot control is the cost of the wholesale electricity it purchases to serve its members. And that cost has increased dramatically.
PJM’s 2024 capacity auction cleared at $269.92 per megawatt-day — more than five times the prior auction’s price of $49.49 per megawatt-day. Pepco Capacity costs represent the price utilities pay to ensure enough power plants are committed to stay online during peak demand periods. When that auction clears at record prices, every utility in the PJM footprint absorbs the increase — investor-owned or cooperative, large or small. There is no way to negotiate around it.
SMECO acknowledges it can only influence approximately 35 to 40 percent of a typical member’s total bill. The remainder — primarily the cost of wholesale power — is set by external markets the cooperative participates in but does not control. Pepco
SMECO has been transparent about this publicly. The cooperative actively manages its capacity demand from PJM where possible and hedges its wholesale power purchases through a mix of long-term, medium-term, and short-term contracts — meaning members pay less than spot market rates, but still more than they did when wholesale costs were lower. Bge The hedging strategy provides some insulation, but it cannot fully offset a fivefold increase in capacity auction prices.
The result is a rate trajectory that looks different from BGE or Pepco’s on a component level but arrives at a similar destination for members’ wallets. The cause is different. The impact is not.
A SMECO-Specific Solar Consideration: The Time-of-Use Rate
SMECO offers an optional Time-of-Use rate structure that is worth understanding for members evaluating solar — because it changes the economics of net metering in a meaningful way.
On SMECO’s standard SOS rate, the per-kWh price is flat regardless of when electricity is used or exported. Net metering credits are applied at that flat rate. For most members, this is the simpler and more predictable structure.
On SMECO’s TOU rate, the on-peak rate is higher than the standard SOS rate while the off-peak rate is significantly lower. For solar owners, this creates an opportunity — solar production during daylight hours, which overlaps with on-peak pricing periods, earns credits at the higher on-peak rate, while any grid consumption shifts to lower off-peak periods. Choose Energy The net effect for well-sized solar systems can be a meaningful improvement in credit value per kilowatt-hour exported.
TOU rates are not compatible with net metering participation on the standard schedule — members on TOU must use the TOU net metering structure. Pepco The practical implication is that switching to TOU requires a smart meter, an understanding of household usage patterns, and a system sized to maximize daytime production relative to on-peak hours. For the right property, it can be a valuable optimization. For others, the flat SOS rate is simpler and nearly as effective.
What This Means for Solar in SMECO Territory
The rate environment in Southern Maryland has changed substantially since 2021. Members who evaluated solar four years ago and concluded the economics were marginal are working from outdated numbers. At 20–22¢/kWh all-in — and with supply rates that have nearly doubled and remain subject to PJM auction outcomes SMECO cannot control — the per-kilowatt-hour offset value of self-generated solar electricity is materially higher than it was.
The cooperative’s own transparency about its cost structure reinforces the case. SMECO explicitly states that it cannot control the 60–65% of member bills driven by wholesale market costs. Pepco Solar changes that equation at the property level. A system installed on a SMECO member’s roof generates electricity at a fixed cost that is not subject to PJM capacity auctions, wholesale fuel prices, or grid constraint pricing. The next capacity auction result — whatever it is — does not affect what it costs to produce a kilowatt-hour on your own roof.
For SMECO members in Calvert, Charles, and St. Mary’s counties with suitable properties, the solar economics at current rates are competitive with any territory in the state. Southern Maryland’s sun exposure is comparable to the rest of Maryland, net metering is available at the full retail rate, and the TOU rate option creates an additional optimization lever for members who want to maximize the value of exported generation.
Individual property variables still determine viability. Usage level, roof orientation, shading, and financing structure all carry weight in the analysis. But the rate environment that now characterizes SMECO territory removes the primary objection that made solar a harder case in Southern Maryland four years ago.
Quick Reference: SMECO Residential Electricity Rates
SOS supply rate (September 2025): 11.0492¢/kWh SOS supply rate (Price to Compare, Feb 2026): ~10.5729¢/kWh Base energy charge (post June 1, 2025 revision): ~10.57¢/kWh Power Cost Adjustment: Variable — ran as high as 17.43% above base rate in early 2025 Distribution charge: ~4.3–4.5¢/kWh EmPOWER Maryland charge: ~1.03¢/kWh Facilities charge: $9.50/month (fixed) Prince George’s County Energy Tax: Applies to PG County addresses only Estimated all-in average: ~20–22¢/kWh (annual average); higher on low-usage summer months Rate sources: SMECO member newsletters, tariff filings, actual customer bills (May 2021, September 2025)
SOS rates adjust when the Power Cost Adjustment triggers the 5% filing threshold for three consecutive months. Delivery charges are set through SMECO’s regulatory rate structure and adjust less frequently. Page last verified: February 2026.